10.1. SLA Dashboard
Created SLA details are displayed in SLA grid as below along with below details:
Name: Name of the BSM
SLA Contract: Name of the contract associated with SLA.
Departments: Department of that BSM. You can assign SLA to multiple departments while creating BSM.
Target/Achieved: SLA target which is set and target achieved (%) is displayed along with SLA State (Clear/Warning/Violated).
Penalty (%): Shows the percentage of penalty applicable on SLA.
Penalty Value: Shows the price value of penalty applicable on SLA.
Trend: Displays the trend about target, achieved and violation.
Health: Health status of BSM (Clear or Critical) that is displayed based on highest alert severity.
Alert: No of alerts getting triggered on selected monitors. Alerts are in Clear or Critical state.
Health Trend: It displayed hourly (last 24 hours) health trend along with alert details. Click on the health trend to see details of business service and monitors in that hour.
Service Status: Shows that the business service is enabled or disabled.
Action: You can edit or delete the BSM.
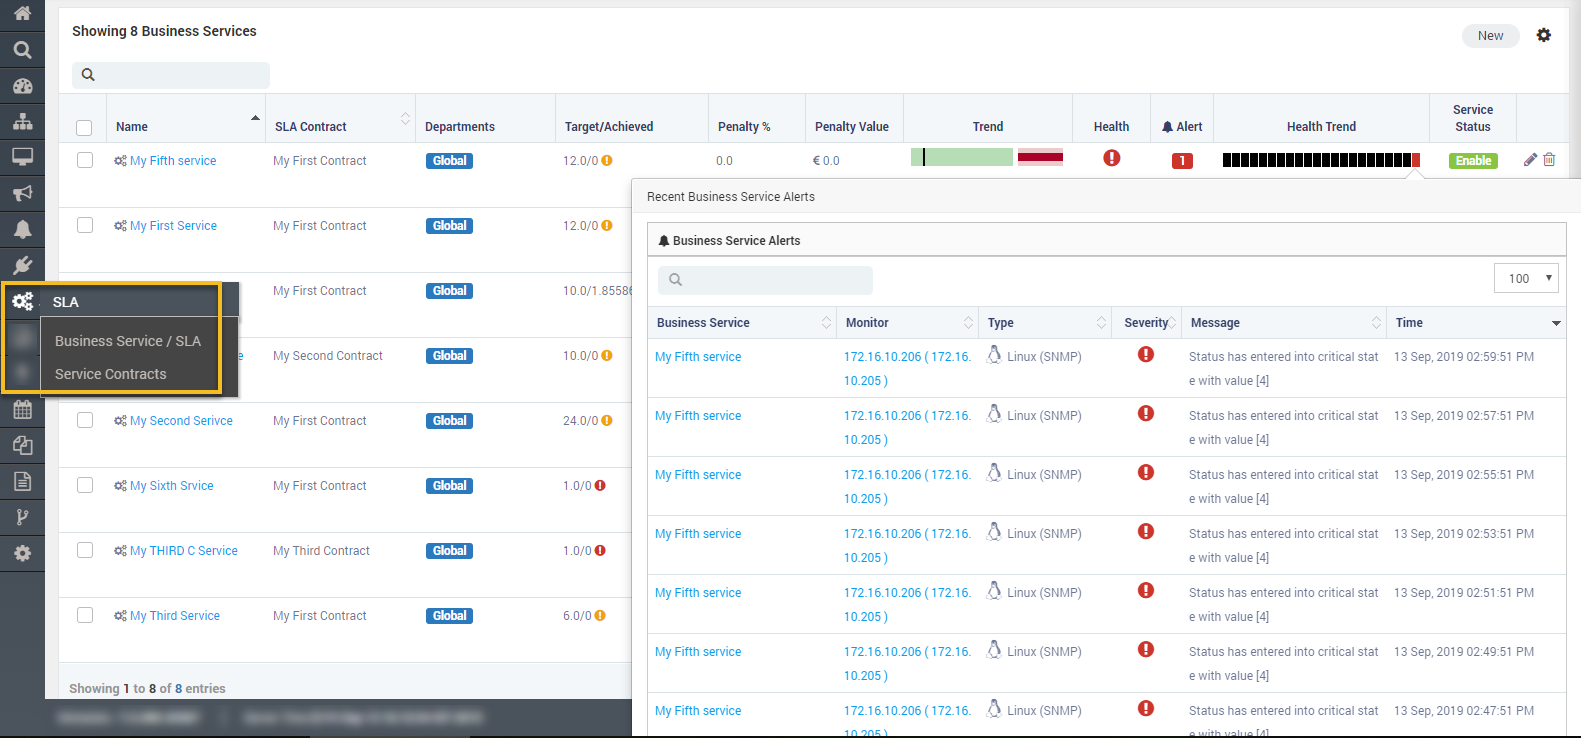
SLA Grid Page